Comparative Analysis of Narrative vs. Numerical Market Forecasting for 2026
- Bryan Downing
- Dec 31, 2025
- 10 min read

Date: December 30, 2025Subject: Global Market Outlook & Methodology Contrast
Introduction: The Eve of 2026
As the trading desks of New York, London, and Tokyo wind down for the final session of 2025, the global financial landscape presents a picture of complex contradiction. We stand at a unique juncture in economic history. The synchronized global growth of the early 2020s is a distant memory, replaced by a fragmented, multi-speed global economy defined by extreme divergence in monetary policy, the maturation of the artificial intelligence industrial revolution, and a commodity super-cycle driven by the green energy transition. This is all about numerical market forcasting in 2026.
For the institutional investor, the question of how to navigate the upcoming Q1 2026 cycle is paramount. However, the answer depends entirely on the analytical framework employed.
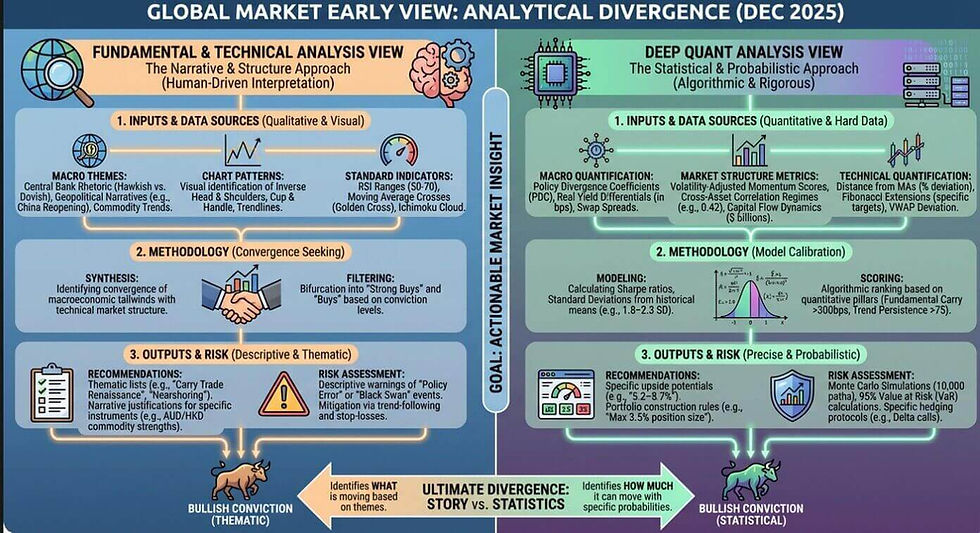
This article presents a comprehensive comparative analysis of two distinct market outlooks generated for December 30, 2025. The first is a Fundamental and Technical Analysis, rooted in macroeconomic theory, geopolitical narrative, and price action heuristics. The second is a Deep Quantitative Analysis, rooted in statistical probability, yield differentials, volatility surfaces, and algorithmic risk assessment.
By placing these two methodologies side-by-side, we do not merely seek to identify what to buy, but to understand the profound difference in why we buy it. We will explore how a fundamentalist sees a "story" where a quant sees a "standard deviation," and how the synthesis of these two worldviews—the "Quantamental" approach—offers the most robust path to alpha in the coming year.
Part I: The Macroeconomic Canvas of late 2025
Before dissecting the methodologies, we must establish the "ground truth" of the market environment as of December 30, 2025. Both reports agree on the existence of specific phenomena, even if they measure them differently.
1. The Great Policy DivergenceThe dominant theme of late 2025 is the chasm between the Bank of Japan (BoJ) and the rest of the G10 central banks. The Federal Reserve (Fed), European Central Bank (ECB), and Reserve Bank of Australia (RBA) have maintained restrictive interest rates to combat sticky inflation and manage labor markets. Conversely, the BoJ remains anchored to a policy of ultra-loose liquidity and Yield Curve Control (YCC). This has created a structural imbalance in global capital flows.
2. The Commodity Super-CycleThe transition to renewable energy has moved from policy ambition to industrial reality. This has created structural deficits in "green metals" (Copper, Silver, Platinum). Simultaneously, traditional energy (Oil, Gas) remains volatile due to geopolitical friction.
3. The Resilience of North AmericaDespite fears of a hard landing in 2024, the US and Canadian economies have proven resilient. The "Nearshoring" phenomenon—moving manufacturing from Asia to Mexico and North America—has fundamentally altered trade balances and strengthened the North American industrial base.
It is against this backdrop that our two analysts—the Fundamentalist and the Quant—begin their work.
Part II: The Narrative Lens – Fundamental & Technical Analysis
The Fundamental and Technical analyst views the market as a mechanism of human psychology and economic logic. For this analyst, an asset price is the intersection of a macroeconomic story (the Fundamental) and the collective emotional state of market participants (the Technical).
The Methodology: Logic and Pattern
In the 2025 report, the Fundamental approach relies on Trend Structure Analysis and Macroeconomic Tailwinds.
Dow Theory & Market Structure: The analyst looks for "Higher Highs and Higher Lows." This is the simplest, yet most enduring definition of a bull market. If the chart is rising from the bottom left to the top right, the trend is respected until proven otherwise.
Pattern Recognition: The report cites specific geometric shapes in price action, such as the "Inverse Head and Shoulders" on AUD/USD or the "Cup and Handle" on AUD/JPY. These are not magical shapes; they represent the psychology of accumulation. An Inverse Head and Shoulders indicates that sellers have exhausted their supply, and buyers are stepping in at higher levels.
The "Story": Every trade must have a "Why." Why is AUD/HKD a Strong Buy? The narrative is clear: Australia sells iron ore (booming), while Hong Kong relies on property (struggling) and is pegged to the US Dollar.
Case Study: The "Strong Buy" Recommendation for AUD/HKD
The Narrative:The Fundamentalist looks at the AUD/HKD pair and sees a clash of economies. Australia is described as a "proxy for global risk appetite." The RBA is hawkish because the Australian economy is overheating from mining exports. Hong Kong, however, is importing US monetary policy due to its currency peg, despite a slowing domestic economy.
The Technical Confirmation:The analyst notes that moving averages are "fanning out in a classic bullish alignment." This visual metaphor is crucial. It implies momentum is accelerating across all timeframes. The "Ichimoku Cloud"—a trend-following indicator—confirms price is above the cloud.
The Conclusion:Buy the pair because the Australian economy is stronger, and the chart confirms that the "Smart Money" is already positioning for this reality.
Case Study: The "Golden Cross" in AUD/USD
The report highlights a "Golden Cross" (the 50-day moving average crossing above the 200-day moving average) for the Aussie Dollar against the Greenback. To the technical analyst, this is a distinct signal. It represents a regime change from a bear market to a bull market. Combined with the fundamental view that the USD is facing "structural headwinds from debt ceiling debates," the trade becomes a conviction play.
Strengths and Weaknesses of this Approach
Strength: It is intuitive. It explains the world in cause-and-effect relationships that human brains are wired to understand. It allows for anticipation of events that haven't happened yet (e.g., "China reopening").
Weakness: It is subjective. One man's "Head and Shoulders" is another man's "Consolidation." It is also prone to narrative fallacy—creating a story to fit the price action, rather than the price action reflecting the story.
Part III: The Statistical Lens – Deep Quantitative Analysis
The Quantitative analyst views the market as a series of probability distributions, correlations, and variances. For the Quant, the "story" is irrelevant noise. What matters is the data. The market is not a battle of bulls and bears; it is a math problem to be solved.
The Methodology: Deviation and Differential
In the 2025 Quant report, the approach is stripped of emotion and replaced with rigorous metrics.
Policy Divergence Coefficient (PDC): Instead of saying "The Fed is hawkish," the Quant calculates the weighted standard deviation of G10 real policy rates. The report notes the PDC is at "1.85%—the 92nd percentile of readings since 2008." This places the current market in a historical context of extreme rarity.
Sharpe Ratio & Volatility: The Quant does not just seek returns; they seek risk-adjusted returns. A trade is only good if the return justifies the volatility. The report highlights that G10 carry trades currently have Sharpe ratios "elevated by 1.8–2.3 standard deviations above historical averages."
Monte Carlo Simulations: To assess risk, the Quant runs thousands of computer simulations (10,000 paths) to see how a portfolio would perform under random future scenarios. This moves risk management from "gut feel" to statistical confidence intervals (95% VaR).
Case Study: The "Strong Buy" Recommendation for AUD/NZD
The Data:The Quant ignores the narrative of "Australian mining vs. NZ farming." Instead, they look at the Swap Spread. The report notes: "The 2-year swap spread between AUD and NZD has widened to 87 basis points." This is a hard number indicating that the bond market is pricing in a divergence in interest rates.
The Technical Structure (Quant Style):The Quant doesn't look for "Cup and Handles." They look at Mean Reversion and Momentum. They note the pair is trading "4.8% above its 200-day exponential moving average." They analyze the "Volume Profile" to see where the majority of trading occurred, identifying that "78% of turnover [is] concentrated in the 5.2–6.8% appreciation range."
The Conclusion:Buy the pair because the math suggests a statistical edge. The "Fundamental Carry Advantage" exceeds 300 basis points annualized, and the "Momentum Sustainability Index" is above 75. It is a probability play, not a prediction.
Case Study: The "Carry Trade" in JPY Crosses
The Quant report identifies a massive opportunity in JPY crosses (USD/JPY, GBP/JPY). But rather than focusing on the BoJ's speeches, they focus on the Yield Differential.
Metric: "340-basis-point JPY carry disadvantage versus the G10 average."
Risk: The Quant calculates the "Intervention Probability" at 22% if USD/JPY moves more than 8% in a month.
Sizing: Because the risk is high, the Quant recommends specific position sizing limits ("Maximum 3.5% of total portfolio AUM").
Strengths and Weaknesses of this Approach
Strength: It is objective and repeatable. It removes emotional bias. It provides precise instructions on position sizing and risk management based on historical data.
Weakness: It is backward-looking. Models are trained on historical data. If a "Black Swan" event occurs (a war, a pandemic, a sudden policy shift that has no historical precedent), the models can fail spectacularly because the correlation matrix breaks down.
Part IV: Divergence & Convergence – A Side-by-Side Comparison
To truly understand the difference, let us look at how these two methodologies analyze the same three asset classes in 2025.
1. The Currency Markets: The Australian Dollar (AUD)
Fundamental View:
Driver: China Reopening and Iron Ore demand.
Signal: Golden Cross on moving averages.
Tone: Optimistic, growth-oriented. "The Aussie is a proxy for global risk."
Quant View:
Driver: 2-year Swap Spreads and Volatility-Adjusted Carry.
Signal: Price vs. 200-day EMA and Volume Profile nodes.
Tone: Clinical. "Sharpe ratio of 0.75 exceeds 78% of historical observations."
Synthesis: Both agree AUD is a buy. The Fundamentalist captures the potential for a China-led boom that the data hasn't fully priced in yet. The Quant ensures we don't over-leverage the trade by highlighting the volatility risks.
2. The Commodity Markets: Gold & Silver
Fundamental View:
Driver: Geopolitical uncertainty, Central Bank buying, and a hedge against fiat currency debasement.
Signal: "Rounding Bottom" pattern and consolidation near highs.
Quant View:
Driver: Correlation to Real Rates (-0.68 to TIPS) and Supply/Demand deficits quantified by ETF holdings vs. Physical demand.
Signal: Standard deviation moves and Mean Reversion targets.
Tone: Cautious. The Quant notes that Gold has a negative correlation to real rates, which are currently high (+2.1%), creating a "headwind."
Synthesis: Here, the views diverge slightly. The Fundamentalist is more bullish based on fear (geopolitics). The Quant is more cautious because the math (high interest rates usually hurt Gold) suggests a headwind. A savvy investor might buy Gold but size it smaller based on the Quant's caution.
3. The Equity Markets: North American Indices (SPX, NAS100)
Fundamental View:
Driver: The AI Revolution and corporate efficiency (cost-cutting).
Signal: "Double Bottom" formations and breaking resistance levels.
Tone: "The labor market refuses to break."
Quant View:
Driver: Earnings Yield (5.8%) vs. Bond Yields. Buyback yields.
Signal: Z-scores of valuation (Forward P/E of 18.2x).
Tone: "Constructive but fragile." The Quant notes the "Equity-Bond Correlation" is at -0.42, which is good for diversification but signals a potential regime shift.
Synthesis: The Fundamentalist provides the conviction to stay in the trade despite high valuations (the AI narrative). The Quant provides the "Sell" signal—if the P/E ratio deviates too far from the 5-year average, the Quant will exit before the narrative collapses.
Part V: Risk Management – Gut vs. Gaussian
Perhaps the most critical difference between the two reports lies in how they handle the possibility of being wrong.
The Fundamental Approach to Risk: "The Pivot"The Fundamental report identifies "Risk Factors" as events.
Central Bank Policy Error: What if the Fed tightens too much?
Geopolitics: What if the war in Eastern Europe escalates?
Mitigation: The advice is reactive. "Investors should focus on trend-following strategies, utilizing pullbacks... while maintaining strict risk management regarding US labor market data."
Critique: This relies on the trader's ability to react quickly to news. It is discretionary.
The Quantitative Approach to Risk: "The Matrix"The Quant report identifies risk as mathematical exposure.
VaR (Value at Risk): "Maximum drawdown in risk-off scenarios modeled at 2.8% (95% VaR)." This tells the investor exactly how much they might lose on a bad day.
Correlation Breakdown: The Quant worries about "Risk-Off Carry Unwind." If volatility (VIX) spikes to 32%, correlations go to 1.0, meaning diversification fails.
Mitigation: The advice is proactive and structural. "Hedge 30% of exposure with 1-month 25-delta calls." "Cap aggregate carry trade exposure at 18%."
Critique: This protects against known unknowns (volatility) but may fail against unknown unknowns (a specific geopolitical event the model hasn't seen before).
Part VI: The "Quantamental" Future
As we look toward 2026, the separation between these two schools of thought is becoming artificial. The most successful institutional investors are increasingly adopting a "Quantamental" approach—using the narrative to generate ideas and the math to execute them.
How to Read the 2025 Reports Together:
Idea Generation (Fundamental): Use the Fundamental report to understand where the world is going. The "Nearshoring" narrative (MXN) and the "Green Transition" (Copper/Silver) are powerful secular trends that pure data might miss because they are structural changes, not cyclical ones.
Validation (Quant): Use the Quant report to check the thesis. Is the carry trade actually profitable after volatility? Is the valuation of the S&P 500 historically extreme? If the Fundamental says "Buy" but the Quant says "Sharpe Ratio < 0.5," you stay away.
Execution (Quant): Use the Quant report for sizing. If the report says "Strong Buy AUD/NZD," the Quant tells you exactly how much to buy (3.5% of AUM) and where to put the stop loss (2.4% below current levels).
Monitoring (Fundamental): Keep an eye on the narrative. If the BoJ suddenly announces a rate hike (a Fundamental change), the Quant models based on historical yield differentials are instantly obsolete. You must exit based on the news.
Conclusion
The "Comprehensive Technical & Fundamental Analysis" for December 30, 2025, paints a picture of a world driven by distinct economic engines—Australian resources, American technology, and Japanese liquidity. It invites the investor to participate in the story of global growth.
The "Deep Quant Analysis" for the same date paints a picture of a world defined by standard deviations and yield spreads. It invites the investor to exploit statistical anomalies while strictly managing the probability of ruin.
Neither is "correct" in isolation. The Fundamentalist risks falling in love with a story that the market stops pricing in. The Quant risks driving by the rearview mirror, blind to the cliff edge of a new geopolitical reality.
For the savvy investor entering 2026, the strategy is clear: Think like a Fundamentalist, but trade like a Quant.
By combining the "Strong Buy" conviction of the narrative with the "Sharpe Ratio" discipline of the math, investors can navigate the divergence of the global markets with both confidence and protection. The alpha of 2026 lies not in the chart or the code, but in the synthesis of both.
Comments