top of page


An In-Depth Technical Briefing for One-on-One with LightningChart Senior Developers
A one-on-one demo with the senior developers of a high-performance tool like LightningChart is a golden opportunity.

Bryan Downing
Aug 5, 20259 min read


How to run Streamlit app vs Grafana and QuestDB
The Simplicity Advantage: Why Streamlit Outshines Grafana and QuestDB for Trading Algorithm Simulations. There is a reason why you should...
Bryan Downing
Jun 16, 20259 min read

Overview of the Project: Nonlinear Correlation Analysis
I’m thrilled to share with you an intriguing quantitative finance project that I’ve been working on. This particular project is coded in Python, and while I’ll be rolling out more advanced projects and demos in C++ as we dive deeper into advanced AI with tools like Anthropic, today’s focus is a simpler yet insightful example of pure quant finance. So, let’s check it out!
Bryan Downing
May 30, 20259 min read


Harnessing LightningChart for Smart Technical Analysis in Automated Trading
In the fast-paced world of automated trading, where milliseconds can translate into significant profits or losses, the ability to...
Bryan Downing
Apr 17, 20253 min read
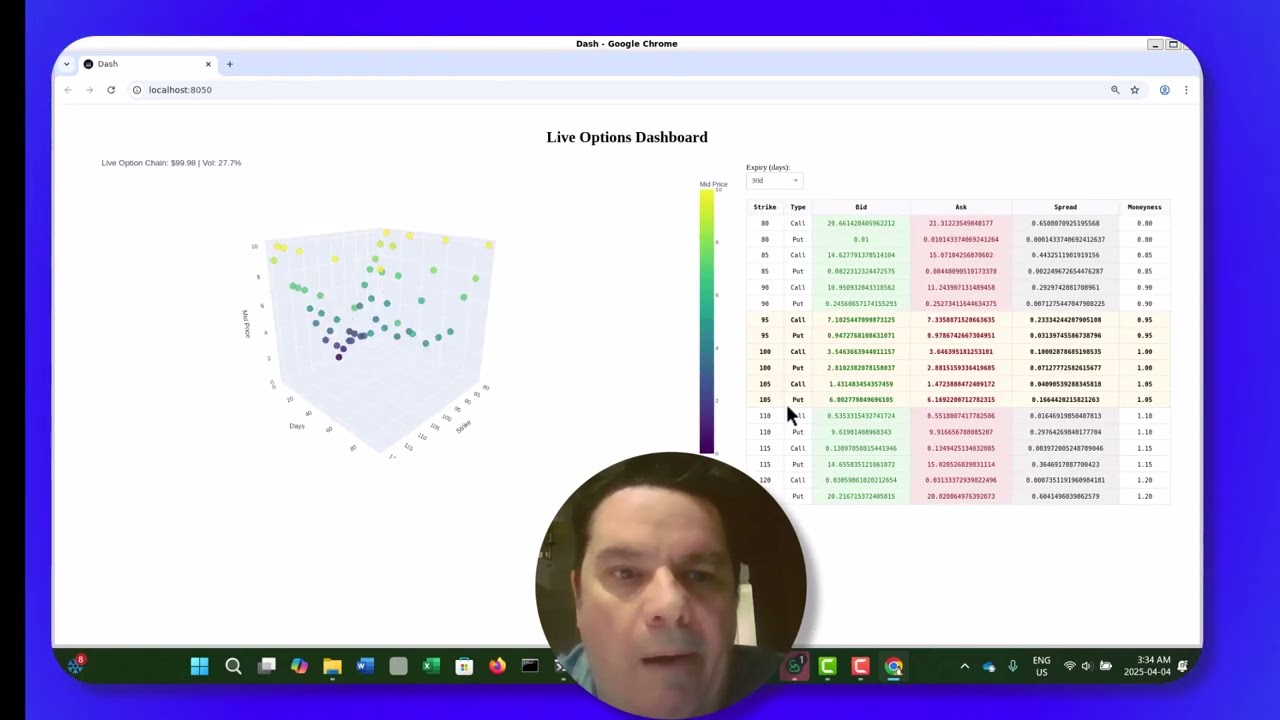
How can Enhanced Real-Time 3D Visualization Tool Revolutionize Options Analysis?
The world of options analysis and trading is characterized by its complexity and speed. Traders grapple with multi-dimensional data – str
Bryan Downing
Apr 4, 202511 min read


SciChart vs. LightningChart: Real-Time Python Trading Charts Compared
Two prominent contenders in this space are SciChart and LightningChart. Both offer powerful charting capabilities, but they cater to slight
Bryan Downing
Mar 20, 20253 min read


How to Use Excel for Options, Futures, and Other Derivatives Analysis
The Options Futures and other Derivatives, encompassing commodities, currencies, and interest rates, form the bedrock of this system, provi
Bryan Downing
Feb 20, 20253 min read


Power of Diffusion Models: A Visual Guide for any Quant Researcher
A Visual Guide to How Diffusion Models Work for any Quant Researcher: Understanding the Key Intuitions Behind Text-to-Image Generative AI fr
Bryan Downing
Feb 8, 20254 min read


How Does the Fixed Income Electronic Trading Platform Utilize the Kx Database for Efficient Operations?
This is where kx, a high-performance time-series database, comes into play. Kx could assist as part of a Fixed income electronic trading pl
Bryan Downing
Feb 3, 20254 min read


Dear ImGui and ImPlot: Powerful Tools for Real-Time Visualization and Tooling
Dear ImGui, a bloat-free graphical user interface library for C++, provides a simple yet effective way to create tools and debug interfaces.
Bryan Downing
Jan 21, 20254 min read


How to Use Python to Demo the Steepening Yield Curve
A steepening yield curve is a graphical representation of the relationship between interest rates (or yields) on debt instruments with diffe
Bryan Downing
Jan 9, 20253 min read


Is Highcharts the Best Option for Stock Market Data Visualization Tools?
Highcharts is a popular JavaScript library for creating interactive charts, including stock charts as one of data visualization tools.
Bryan Downing
Nov 12, 20242 min read
bottom of page